Published March 2025*
|
Prepared for you by: Laura Cole & Tana Gaskill |
| Number of Homes For Sale vs. Sold vs. Pended (Dec. 2023 - Feb. 2025) | ||||||||||||||||||||||||||||||||||||||||||||||||||||||||||||||||||||||||||||||||||||||||||||||||||||||||||||||
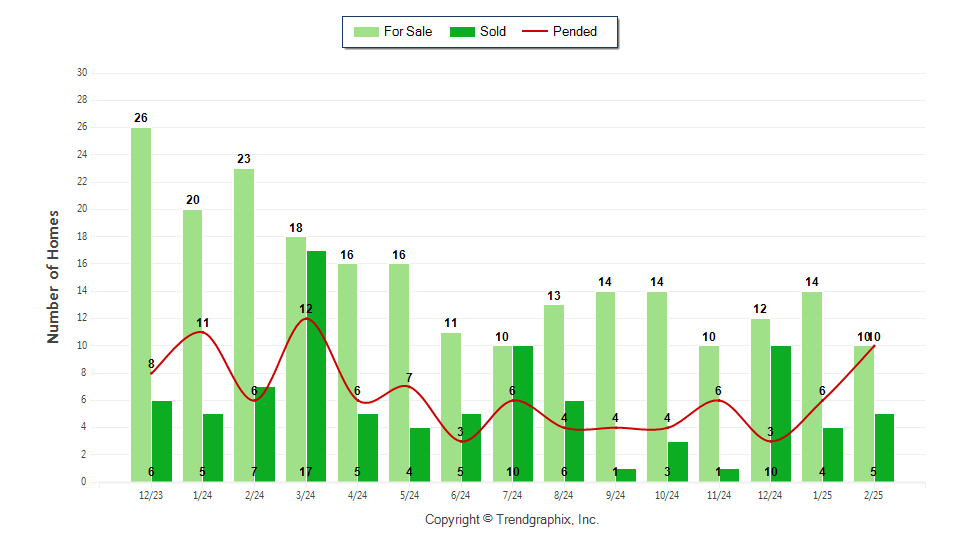
February 2025 was a Seller's market** **Buyer's market: more than 6 months of inventory based on closed sales. Seller's market: less than 3 months of inventory based on closed sales. Neutral market: 3 - 6 months of inventory based on closed sales. |
||||||||||||||||||||||||||||||||||||||||||||||||||||||||||||||||||||||||||||||||||||||||||||||||||||||||||||||


| Average Price per SQFT (Sold) (Dec. 2023 - Feb. 2025) | ||||||||||||||||||||||||||||||||||||||||||||||||||||||||||||||||||||||
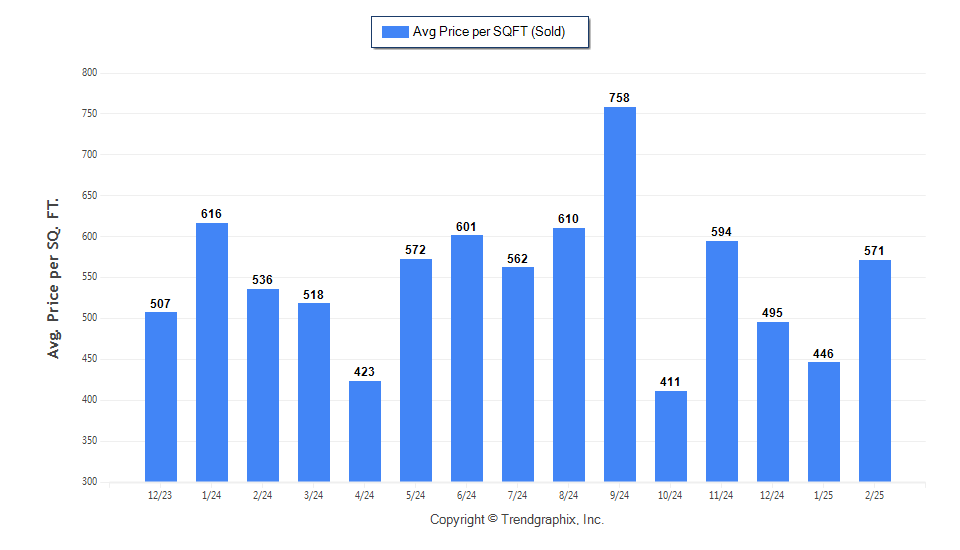
February 2025 Average Sold Price per Square Footage was Neutral** **Based on 6 month trend - Appreciating/Depreciating/Neutral. |
||||||||||||||||||||||||||||||||||||||||||||||||||||||||||||||||||||||
| Avg Days On Market & SP/Orig LP % (Dec. 2023 - Feb. 2025) | ||||||||||||||||||||||||||||||||||||||||||||||||||||||||||||||||||||||||||||||||||||||||||
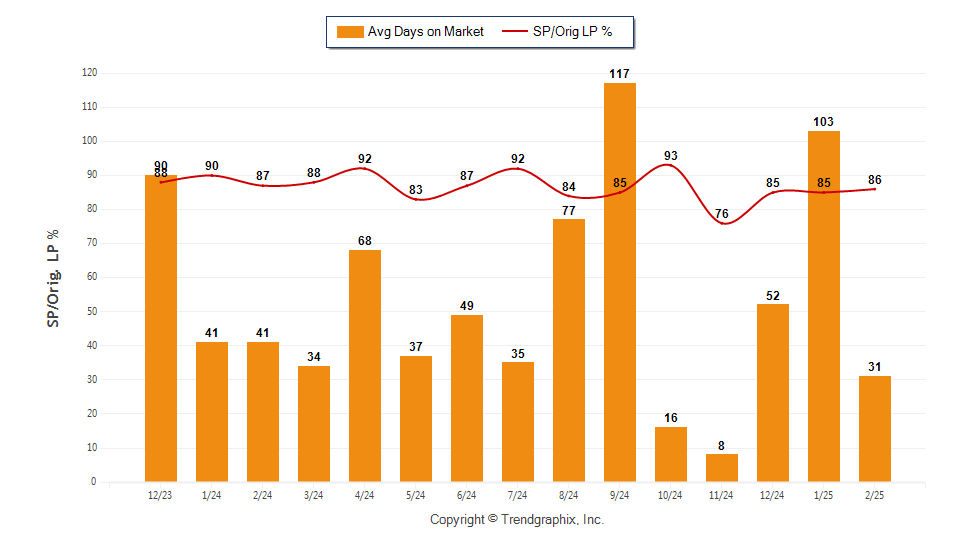
February 2025 Average Days on Market trend Remains Steady** February 2025 Sold/Original List Price Ratio Remains Steady** **Based on 6 month trend - Rising/Falling/Remains Steady. |
||||||||||||||||||||||||||||||||||||||||||||||||||||||||||||||||||||||||||||||||||||||||||
| Average Price of For Sale and Sold (Dec. 2023 - Feb. 2025) | ||||||||||||||||||||||||||||||||||||||||||||||||||||||||||||||||||||||||||||||||||||||||||
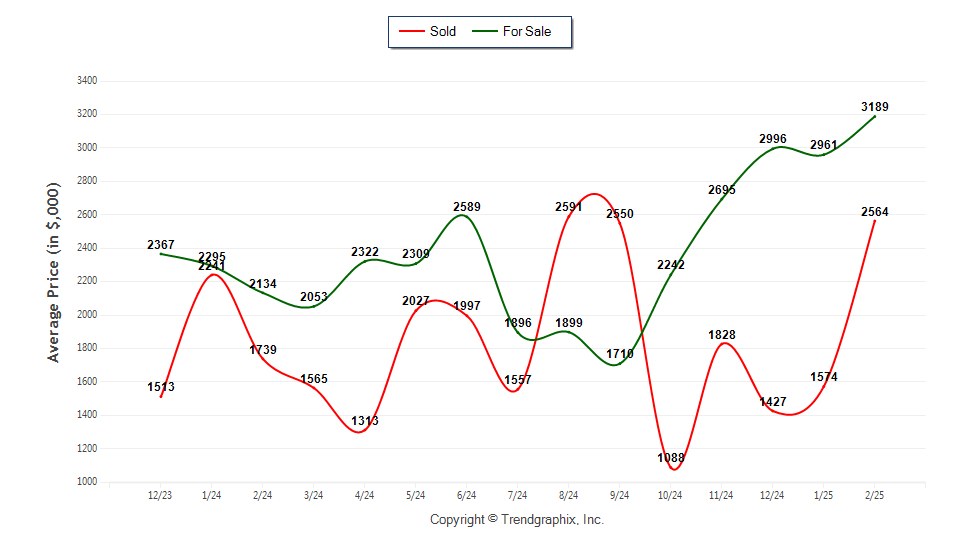
February 2025 Average For Sale Price was Appreciating** February 2025 Average Sold Price was Appreciating** **Based on 6 month trend - Appreciating/Depreciating/Neutral. |
||||||||||||||||||||||||||||||||||||||||||||||||||||||||||||||||||||||||||||||||||||||||||
| Months of Inventory Based on Closed Sales (Dec. 2023 - Feb. 2025) | ||||||||||||||||||||||||||||||||||||||||||||||||||||||||||||||||||||||
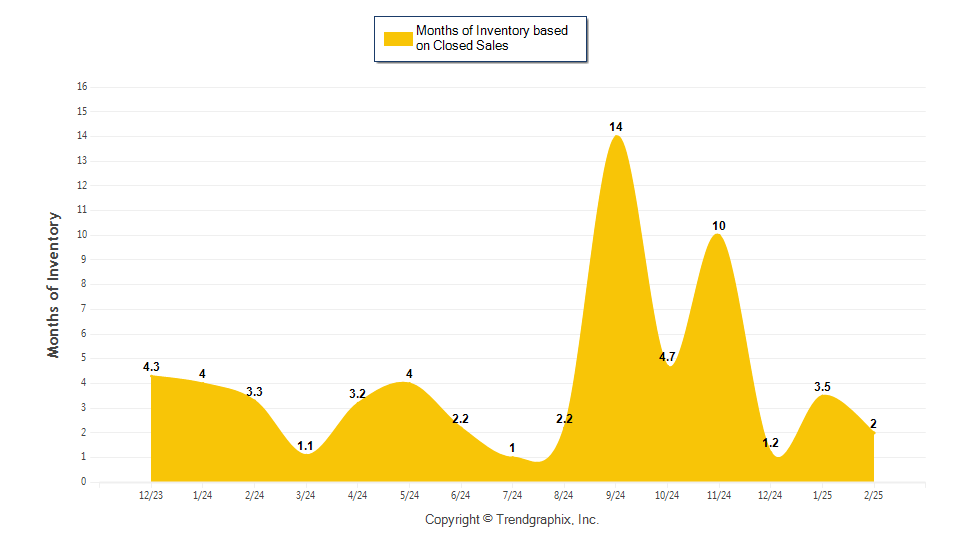
February 2025 was a Seller's market** **Buyer's market: more than 6 months of inventory based on closed sales. Seller's market: less than 3 months of inventory based on closed sales. Neutral market: 3 - 6 months of inventory based on closed sales. |
||||||||||||||||||||||||||||||||||||||||||||||||||||||||||||||||||||||
|
|||||||||||||||||||||||||||||||||||||||||||||||||||||||||||||||||||||||||||||||||||||||||||||||||||||||||||||||||||||||||||||||||||||||||||||||||||||||||||||||||||||||||||||||||||||||||||||||||||||||||||||||||||||||||||||||||||||||||||||||||||||||||||||||||||||||||||||||||
|
If your email program is not displaying the chart graphs properly, please click on the following link which will take you to a web page that contains the graphs:Show Chart *All reports are published March 2025, based on data available at the end of February 2025, except for the today’s stats. This representation is based in whole or in part on data supplied by Realtor Association of The Palm Beaches, Jupiter, Tequesta, Hobe Sound Association of Realtors, and St. Lucie Association of Realtors. Neither the Board nor its MLS guarantees or Neither the Boards nor its MLS guarantees or is in any way responsibles for its accuracy. Data maintained by the Board or its MLSs may not reflect all real estate activity in the market. Report reflects activity by all brokers participated in the MLS. |